Who wants to be a Data Scientist at Miniclip?!

miniclip_jobs_banner-1024x200

Small break in the blog posting holiday break to let everyone know that Miniclip is hiring… well… we’ve been hiring for quite a while so I guess it’s not a big surprise. The reason why I’m posting is because we’re looking for a Data Scientist to work with yours truly, while pretending for dramatic effect that you didn’t read the title and are really surprised!

You can see the job description (and apply!) following this link. However I want to give you a bit more information than just the job title and job description.

At Miniclip anyone in the Data Science and Data Engineering teams can be involved in data science projects. Analysts, engineers, scientists and team leads have different operational responsibilities but our major strength is that we work as a multidisciplinary team.

And what data science projects are those you ask? As I see it, Data Scientists build data products. Data products are automated or interactive data centric applications that would not be possible using traditional systems. What on earth does this mean? What about some real examples at Miniclip:

  • UA LTV: An interactive data product that allows business users to analyse predicted LTV across all possible cohort combinations. Business users can also export data to create reports. This export includes the mentioned LTV predictions but also retention rate predictions. This data product was coded in R with Shiny and interacts with S3, Redshift and EC2 instances in AWS. Cute statistic, although the models are very simple, there are 724 of them in the application. At peak it runs more than 200.000 predictions under 4 minutes. Not too shabby for an interactive application.
  • Fraud Detection: An automated predictive data product coded in R running on an EC2 instance. Although it is a rather simple script, the beauty is that the algorithm was coded in house. Redshift and MySQL are also used.
  • The Super Hyper Secret Mega Project That I Will Not Name: I know… I know… if I’m not going to explain it, why say it? Because of the history and the tech. This is the project I’m currently working on and is the end game of almost a year of prototypes, investigation and analysis. From random forests and SVMs to association rule mining, from Python to R, from local data sets to terabytes of data.
  • User Stats: An interactive data product that I list here because it is NOT predictive. In a nutshell, no dashboard tool could create exactly what our Customer Support team needed… so we did it ourselves! This application queries and builds visualisations across billions of rows of data.

We have many cool projects to build, a lot of things to learn together. If building machine learning models, writing code, building applications and playing games is your thing and you are not afraid of a lot of data, click here and see you soon!

 

So… holidays!

1-1256139512vl7e

I’m on holidays! And Pedro is too! I’m camping (sort of…) near the beach and Pedro is… well… he is a bushcraft master so he is probably hunting his next meal somewhere in the wilderness with nothing but a pebble and his wits.

Although I’ve been a boy scout and I was in the military for a short time, I’ll always be a city guy and like any other lame city guy my countryside vacations is defined by a 4G connection, my faithful laptop and a hammock. That’s how I’m writing this.

So what is going on?

  • I’m doing some work on a lifetime value predictive data product. Although I won’t share the inner and deeper secrets I will post about more technical aspects of machine learning and data science.
  • I’m studying machine learning in Python. This is something I’ve looking forward for a long time since I mostly work in R but I just LOVE Python! I’ll publish the repo with the code and review the book I’m reading because it is awesome!
  • Writing new and exciting post for the blog. I wouldn’t forget you, would I?

So see you all in some weeks. We will be out resting and coding and drawing and writing.

p.s.: Little secret only between the two of us. The boy scouts… that’s where I met Pedro!

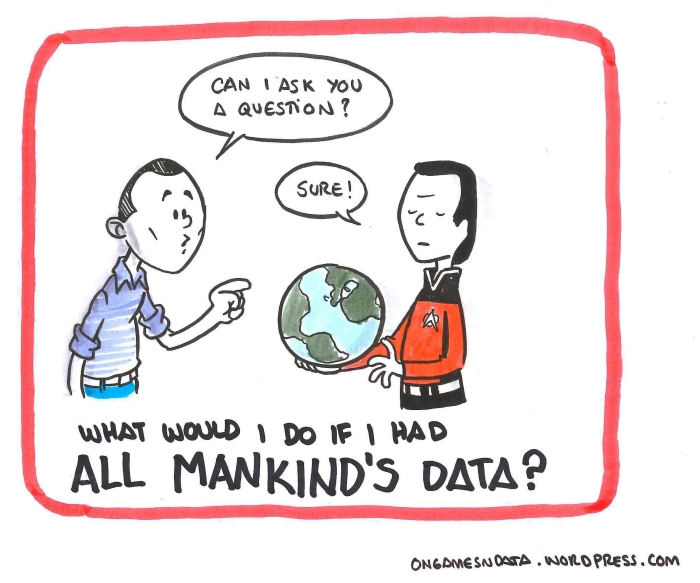
What would I do if I had all mankind’s data?

alldata

This post is almost a verbatim text from an answer I gave on Quora. The question itself was pretty cool: If you had access to all the data in the world since the dawn of mankind, what would you do, which hypotheses would you test?

This post has most of the content of the answer I wrote and a bit more philosophical insight. But in case you are interested, here’s the link to my answer on Quora.

So if you are not into philosophical ramblings, see you next week! If you are or simply enjoy philosophical ramblings, keep reading!  Continue reading

If the world were 100 people

I usually have a backlog of posts, more or less ready to publish. Looking at those posts, it seems that I’m taking a path of social awareness. It was not premeditated, it just happened… it is also not something that I’ll actively pursue but I’m also not inclined to avoid it.

This was the last post of this sort I started writing but the one that I finished first and it is a nice way to kick off these posts with the power of visualisation. Continue reading

Game Analytics and Business Intelligence 2016

gabi2016.png

Hey!

Quick note today to announce the Game Analytics and Business Intelligence 2016! Or the more cute name: GABI. In case you don’t know what this is about, GABI is a conference in London about… erm… game analytics and business intelligence… in… well… video games! Not too big, not too small, a lot of time to get to know people and exchange experiences and ideas, a really cool conference.

It is the third year the event is going to take place and one of the things I find more interesting about it is how we are able to observe the growth of analytics in video games. I’ve not missed one so far and I certainly won’t miss this. It would be kinda bad to skip it this year since… suspense… I’ll be a speaker this year! And further representing Miniclip, the one and only Paul Bugryniec, Head of BI and the guy that has the distinct pleasure of being my line manager will also speak.

One of things I find most interesting this year is the diversity of speakers. GABI will have video game companies from AAA to mobile but also from outside the industry like Spotify.

And if you want to find out more, check the website!


Is it a year already?

OGND 024

Yep… On Games N’ Data, this crazy little niche blog that I have the pleasure to share with Pedro and you all published its first page one year ago. In case you like cozy feelings or you didn’t read the first post back then, here’s the link.

And what is the proper way to celebrate? With data!

This is the 52nd post. The average number of words per post is roughly 500. But who likes aggregations? Let’s get crazy and draw conclusions from insufficient data, shall we? For instance what were the top 3 most viewed posts?

ognd 0033rd place: Retention 101

I have to say that I’m very happy that this post hit the podium. Retention is vital. It is the number 1 thing to look at. It says so much, so quickly and it is so easy to interpret, although very hard to infer causal relationships.

The fact that the most important post about retention is here says quite a lot about you, the people that read this blog. Well… it doesn’t! But using scientific trademark language “it suggests” that you worry and read the right things!

ognd 0092nd place: The Holy Trinity of Monetisation

Although I’m not really sure what people searched to find this particular post, it is very interesting that this, and not Monetisation 101 or other simpler posts, is in number 2. I understand that monetisation is important but I’m a bit surprised that this particular post and not other on the same subject is here.

Maybe it is because it presents the formulas and people are searching for them.

There are two things that I love about this post. The first is that it was the first time I brought a tad more complex mindset in terms of using analytics by evaluating multiple KPIs instead of one high level one. The second is the awesome artwork by Pedro. I wonder if anyone noticed that the formulas are in the art? It’s mind blowing how he was able to tell the whole story in one graphic.

so_you_want_to_have_suga_660w1st place: So you want to have game analytics, huh?

And the top place goes to the post that started the Setting Up Game Analytics.

I was expecting this.  The blog content was designed to get to this specific post. Going through the player lifecycle up to setting up the game analytics stack. Other content popped up in the meantime but this was the objective: to help developers getting their analytics in place. This was what I didn’t have when I started and it was what I wanted to offer.

From the feedback I received I can only conclude that the people that visit this blog find it at least useful, at best also entertaining. When I discussed it with Pedro, we agreed that we didn’t want something big, we wanted something truthful and unique. I’m personally very happy with this year of blogging, hope all of you (that’s a bit north of five thousand by the way) agree with me.

I would say we should give it at least one more year. Thank you for reading, see you next week!

The Dumb Data Science X vs Y Wars

ognd 023

Yep it’s a rant… announcing ahead that a blog post is a rant is almost a tradition since before blogs were cool and web forums were the thing. If someone in some obscure web forum started a post with <rant> or “Rant Mode On” and other derivatives, he was signaling “I’m not a troll but I’m really upset!”

It is a message with mixed signals between “keep reading because I’m going to get nasty and you’ll like it” and “you can just skip if you need apologies if and when a web user get’s crazy”.

Either you got the idea by now or you know what I’m talking about for two whole paragraphs and you’re itching for the juicy stuff. So, here goes…

Rant Mode On!  Continue reading

Retention and Churn

This post was written 10 months ago… yep, right after Retention 101. Since then it has been in an out of the publishing queue. I’ve been picking up things to improve it but it doesn’t make sense to keep it out… and it took too long really! I wanted to improve it beyond this but it’s better to simply publish it and follow up if I make up my mind about what is that magical improvement than to leave it lingering in the Drafts section any longer.

This post is about ways of measuring retention, how each of them relates with true churn and which should be used.

Retention 101 post was an overall intro. I gave the formula generally used to calculate retention and mentioned there are other ways of calculating it. This post is about those additional formulas, namely rolling retention and rolling window retention and also about churn.

Each retention formula has strengths and weaknesses. Some are more adequate for reporting, other’s for modelling and each has a different relationship with churn. Let’s start! Continue reading

Databases and tables for game analytics

databases_and_tables.jpg

It has been some time so let’s recap how we got here. First I gave an overview of what a game analytics stack can be. Then I moved to the planning stage pointing the steps from zero to data science. In the last couple of posts in this category I wrote about basic events. First how to think and define them, later on the structure of the data created from those events. The last couple of posts were about user state, what it is and how we can use it.

I think it is abundantly clear that there is method in the madness! Today I’ll write about the databases and tables needed for basic reporting. Not only the definition of the fields but also different structures and technical considerations.  Continue reading