So… holidays!

1-1256139512vl7e

I’m on holidays! And Pedro is too! I’m camping (sort of…) near the beach and Pedro is… well… he is a bushcraft master so he is probably hunting his next meal somewhere in the wilderness with nothing but a pebble and his wits.

Although I’ve been a boy scout and I was in the military for a short time, I’ll always be a city guy and like any other lame city guy my countryside vacations is defined by a 4G connection, my faithful laptop and a hammock. That’s how I’m writing this.

So what is going on?

  • I’m doing some work on a lifetime value predictive data product. Although I won’t share the inner and deeper secrets I will post about more technical aspects of machine learning and data science.
  • I’m studying machine learning in Python. This is something I’ve looking forward for a long time since I mostly work in R but I just LOVE Python! I’ll publish the repo with the code and review the book I’m reading because it is awesome!
  • Writing new and exciting post for the blog. I wouldn’t forget you, would I?

So see you all in some weeks. We will be out resting and coding and drawing and writing.

p.s.: Little secret only between the two of us. The boy scouts… that’s where I met Pedro!

What would I do if I had all mankind’s data?

alldata

This post is almost a verbatim text from an answer I gave on Quora. The question itself was pretty cool: If you had access to all the data in the world since the dawn of mankind, what would you do, which hypotheses would you test?

This post has most of the content of the answer I wrote and a bit more philosophical insight. But in case you are interested, here’s the link to my answer on Quora.

So if you are not into philosophical ramblings, see you next week! If you are or simply enjoy philosophical ramblings, keep reading!  Continue reading

If the world were 100 people

I usually have a backlog of posts, more or less ready to publish. Looking at those posts, it seems that I’m taking a path of social awareness. It was not premeditated, it just happened… it is also not something that I’ll actively pursue but I’m also not inclined to avoid it.

This was the last post of this sort I started writing but the one that I finished first and it is a nice way to kick off these posts with the power of visualisation. Continue reading

Is it a year already?

OGND 024

Yep… On Games N’ Data, this crazy little niche blog that I have the pleasure to share with Pedro and you all published its first page one year ago. In case you like cozy feelings or you didn’t read the first post back then, here’s the link.

And what is the proper way to celebrate? With data!

This is the 52nd post. The average number of words per post is roughly 500. But who likes aggregations? Let’s get crazy and draw conclusions from insufficient data, shall we? For instance what were the top 3 most viewed posts?

ognd 0033rd place: Retention 101

I have to say that I’m very happy that this post hit the podium. Retention is vital. It is the number 1 thing to look at. It says so much, so quickly and it is so easy to interpret, although very hard to infer causal relationships.

The fact that the most important post about retention is here says quite a lot about you, the people that read this blog. Well… it doesn’t! But using scientific trademark language “it suggests” that you worry and read the right things!

ognd 009
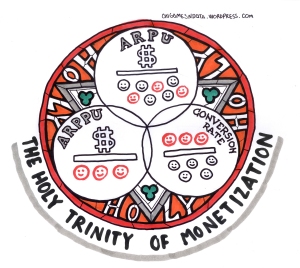
2nd place: The Holy Trinity of Monetisation

Although I’m not really sure what people searched to find this particular post, it is very interesting that this, and not Monetisation 101 or other simpler posts, is in number 2. I understand that monetisation is important but I’m a bit surprised that this particular post and not other on the same subject is here.

Maybe it is because it presents the formulas and people are searching for them.

There are two things that I love about this post. The first is that it was the first time I brought a tad more complex mindset in terms of using analytics by evaluating multiple KPIs instead of one high level one. The second is the awesome artwork by Pedro. I wonder if anyone noticed that the formulas are in the art? It’s mind blowing how he was able to tell the whole story in one graphic.

so_you_want_to_have_suga_660w1st place: So you want to have game analytics, huh?

And the top place goes to the post that started the Setting Up Game Analytics.

I was expecting this.  The blog content was designed to get to this specific post. Going through the player lifecycle up to setting up the game analytics stack. Other content popped up in the meantime but this was the objective: to help developers getting their analytics in place. This was what I didn’t have when I started and it was what I wanted to offer.

From the feedback I received I can only conclude that the people that visit this blog find it at least useful, at best also entertaining. When I discussed it with Pedro, we agreed that we didn’t want something big, we wanted something truthful and unique. I’m personally very happy with this year of blogging, hope all of you (that’s a bit north of five thousand by the way) agree with me.

I would say we should give it at least one more year. Thank you for reading, see you next week!

The Dumb Data Science X vs Y Wars

ognd 023

Yep it’s a rant… announcing ahead that a blog post is a rant is almost a tradition since before blogs were cool and web forums were the thing. If someone in some obscure web forum started a post with <rant> or “Rant Mode On” and other derivatives, he was signaling “I’m not a troll but I’m really upset!”

It is a message with mixed signals between “keep reading because I’m going to get nasty and you’ll like it” and “you can just skip if you need apologies if and when a web user get’s crazy”.

Either you got the idea by now or you know what I’m talking about for two whole paragraphs and you’re itching for the juicy stuff. So, here goes…

Rant Mode On!  Continue reading

Learning data science with John Oliver

1024px-john_oliver_6

You know this guy, right? In case you don’t, he is John Oliver, an english comedian with a perspective on the modern world that can only be matched by his distinctive voice!

I saw the video below sometime ago. In it, John Oliver presents in his usual style what is wrong with how science is used and presented. I won’t discuss the large amount of pet peeves I have with what I see on mainstream media or shared on Facebook regarding science or the lack of it. It would be out of context, too long and, to be intellectually honest, incredibly boring especially after John’s tremendous piece.

Instead I want to invite to watch the video in case you haven’t and I’ll tell you why I believe his views are important in the context of data science also.  Continue reading

Beautiful Visualisation: The Fallen of WWII

Screenshot 2016-05-03 21.22.29

According to the website…

The Fallen of World War II is an interactive documentary that examines the human cost of the second World War and the decline in battle deaths in the years since the war.

I took this screenshot because it fits the description. But neither the description or the screenshot are fair to this visualisation. This is a true masterpiece. It is a data visualisation and a documentary. A short movie and an experiment. It is art, history, data. It is about death and hope. It is dark yet vibrant.

I want to tell you more… and I want to share the video in this page… but I’ll fight the urge and won’t do either. I won’t spoil and I won’t embed because I want to invite you to visit the website, try the interactive visualisation and watch the documentary… if you are at work be sure you have 18 minutes.

Visit The Fallen of World War II


Why I never liked the term ‘whales’

WHALES

If you follow this blog you probably know what a whale is in the context of freemium games. If you follow this blog you might have (or not) noticed that I have not used the term whale. Or freeloader… or minnow… or dolphin!

I have very strong feelings regarding this. Here’s why.  Continue reading

You might be a data redneck…

you_might_be_a_data_redneck_2.jpg

I like comedy a lot and stand up in particular. Some years ago I saw a video of The Blue Collar Comedy Tour. While I am not a fan and was only mildly entertained, there was a piece of it by Jeff Foxworthy that, I learned later, it’s sort of his stand up business card. That piece is widely known as “You might be a redneck”.

To Jeff, the definition of redneck is and I quote “The glorious absence of sophistication”. Let’s save this bit for later…

The reason why I’m writing this post is because in this day and age every knowledge worker claims to be data driven(*)… and many aren’t. This is a very touchy subject. The reason is simple. If everyone around me says they are data driven, it is very hard for me to admit that I’m not. It is even harder to say “I don’t know” when everyone seems to know.

Trust me on this, most don’t know! It is ok to not know. It is the prerequisite to start learning. The problem is that with so many people “knowing” there is a vast widespread glorious absence of data sophistication… See what I did there? 😉
Continue reading

How to come up with the important business questions?

ognd 021

Sometime ago I wrote a blog post on why questions are better than data. Zach Riegler from Upsight commented:

Very insightful post. Now for the most important questions – what is the best way to come up with the most important business questions to ask…?

This post is about that: the important questions. What they are and how to get them. It’s about the thought process and a sneak peak on how analysts, scientists and statisticians translate business questions to quantitative questions that can be answered with data.

Let’s go!  Continue reading